Abortion is a hotly debated topic in the US. The 1973 Supreme Court judgment has as many detractors as supporters. Here are some abortion statistics that will open your eyes to the reality of the issue.
Abortion continues to remain a thorny issue in the medical profession with political and religious ramifications. On the one hand there are advocates of women’s right to choose and on the other, we have those who advocate for the rights of the unborn fetus.
But what are the real abortion numbers in the US? And what do they mean?
Over the years, the total number of abortions and the rate of abortions per 100 pregnancies, both, have come down significantly.
The primary reasons for these changes have been better and more readily available contraceptive methods and changes in the demographics and backgrounds of the women choosing abortion over the years.
Political issues related to abortion in the US have also affected women’s reproductive and health rights.
Let us dive right in to the statistics.
Contents
Statistics on Abortion in the US
- There were 195 abortions per 1000 live births in 2019.
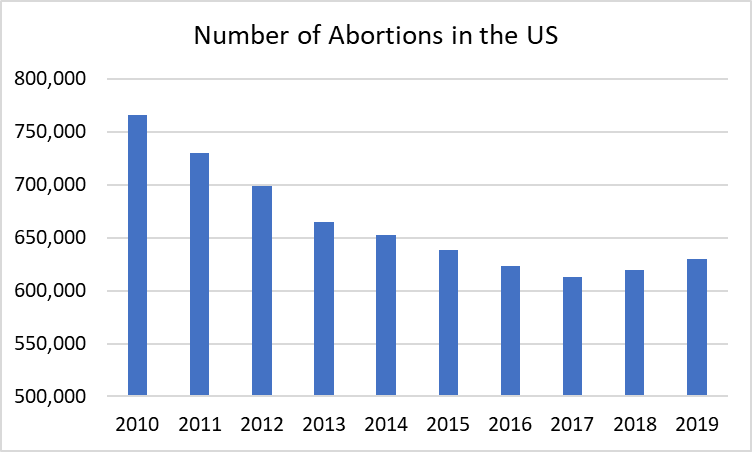
- There were a total of 630 thousand abortions in the US in 2019.
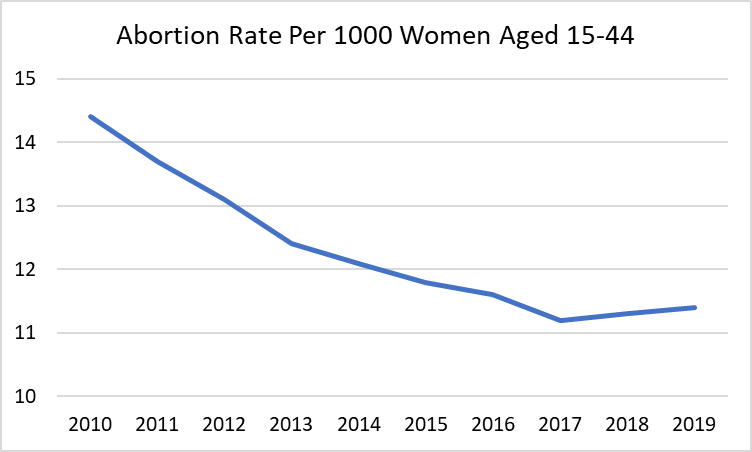
- 11.4 women out of 1000 aged between 15 and 44 underwent an abortion in 2019.
- The abortion rate (number of abortions per 1000 live births) has seen a steady decline in the US. In 2000, the abortion rate in the US stood at 21.3 abortions per 1000 women between 15 and 44 years of age. By 2019, it almost halved to 11.4.
- 58% of women aged 13 years to 44 years live in areas hostile to abortion rights.
- 59% of women who opt for abortion have already been pregnant before.
- In 2014, 12% of women who went for abortion were adolescents. The abortion rate among women aged 18 to 19 was 8%, 15 to 17 years were 3%, and for those younger than 15 years was 0.2%.
- 72% of clinics would be willing to do the abortion process for 12 weeks gestation period. At 20 weeks gestation, this number fell to 25%. Only 10% of clinics offer abortion services for women at 24 weeks gestation period.
- In the period between 2001 to 2017, medication abortion has significantly increased from 5% to 39%, and the total number of abortions has reduced.
Source – Guttmacher Institute, CDC.
Statistics on Reasons for Abortion
The reasons to terminate a pregnancy are pretty complex, and the demographic changes over the decades highlight why women go for abortion.
As expected, one of the biggest reasons cited by women for abortion is financial. But when we peel back the layers, there are multiple factors influencing the decision of a woman when it comes to choosing to terminate a pregnancy.
When looking at the numbers, please note that a woman could have had multiple reasons to choose abortion.
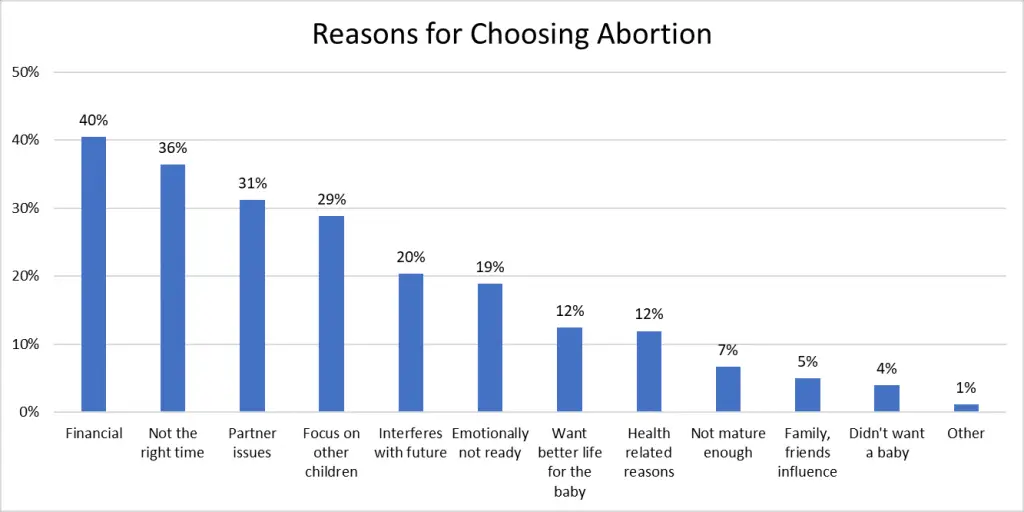
- Four out of 10 women (40%) seeking an abortion cited that they were not prepared to financially bear the burden and long-term commitment of having a child.
- A similar number, 36% were making this choice because they felt that it was not the right stage in their life to have a baby.
- 3 out of 10 women or 31% reported some kind of issues with their partners as their main reason for seeking an abortion. Most commonly they were in a bad relationship or unsupportive relationship.
- A very similar number – 29% of women wanted to focus on their existing children and give them a better life rather than bearing a new child.
- 20% were worried that childbearing would impact their future prospects and career opportunities.
- 19% were emotionally unprepared to bear a child.

- 12% mentioned health-related issues that impacted their pregnancies. Another 12% said that they wanted a better life for the baby than they were able to provide at that stage of their life.
- 7% mentioned that they were not mature enough to have a baby and another 5% mentioned influence from family and friends as their biggest reasons for choosing to abort their pregnancy.
Source – BMC Women’s Health
Illegal Abortion Statistics Before 1973
Before 1973, abortion was strictly restricted in America by law. Which also meant that there was a thriving back-alley abortion industry.
Americans may not remember today that illegal abortions were very common before 1973. In a landmark judgment in the 1973 case of Roe v. Wade, the supreme court recognized a woman’s right to abort her fetus.
The court also balanced the absolute right of the woman to choose an abortion against the state’s ability to refuse that right at around the end of the second trimester, when the fetus became capable of existing on its own.
Here are some illegal abortion statistics before 1973.
- It is estimated that up to 1.2 million illegal abortions every year in the US in the 1950s and 1960s.
- In 1955, almost 700,000 illegal abortions were performed in America. In 1967, almost 830,000 illegal abortion procedures were performed.[2]
- Illegal abortions were a leading cause of pregnancy-related deaths. In 1965, there were 200 cases of deaths due to illegal abortions reported in the US. That contributes a shocking 17% to the total of around 1200 pregnancy-related deaths that year. Please note that this is the reported number. The real figure is likely much higher.
- Because some states allowed for abortions under certain circumstances, affluent women were able to access safer, medically sound termination of pregnancy. It was reported that between 1951 and 1962, 88% of legal abortions that were performed in New York City were performed by private physicians. This also meant that those who could not access private practice had no recourse in the public health care system.
- After 1973, when the Supreme court ruled in the favor of women’s right to abort the fetus, illegal abortions almost disappeared overnight. In the period between 1972 to 1974, the number of illegal abortions in the US plunged from 130,000 to a mere 17,000.
- The total number of deaths due to abortions declined from 39 to 5 in the same period.
- The most common age group where deaths happened due to abortion was 20 to 24 years of age followed by 25 to 29.
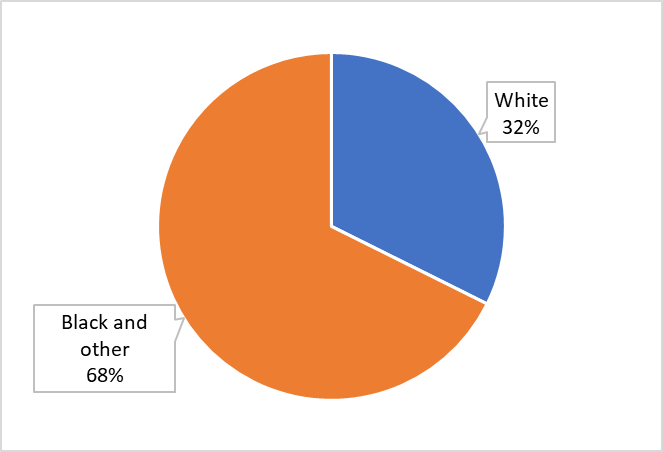
- More than two out of three (68%) pregnancy-related deaths in 1972 and 1973 were attributed to black or other ethnicities and less than one in three (32%) were white.
Source – National Library of Medicine
Abortion Because of Rape Statistics
- Almost 3 million women in the US have experienced rape-related pregnancies in their lifetimes.
- As a percentage of population, the incidence of rape-related pregnancies is highest among black women, followed by Hispanic women. It is the least among white women.
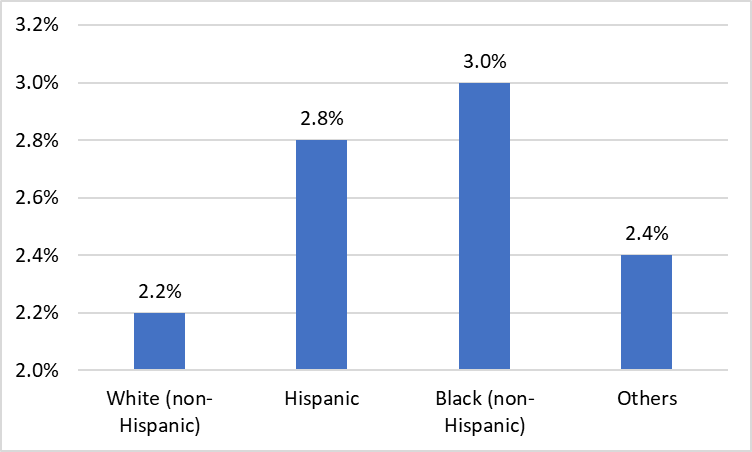
- Five percent of women of reproductive age (12 to 45 years) experience rape-related pregnancy.
- More than 32,000 adult women get pregnant from rape each year.
- Only 11.7% of the victims received immediate medical attention. Almost half the victims (47.1%) received no rape-related medical attention.
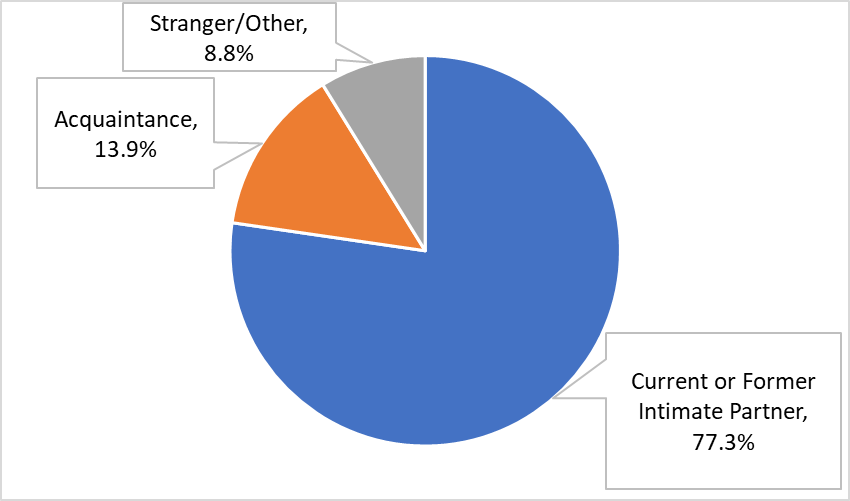
- More than three in four women (77.3%) who related a rape-related pregnancy, identified the perpetrator to be a current or former intimate partner. Another 14% reported it to be an acquaintance.
- 30% of women who were raped by their intimate partner encountered reproductive coercion.[4]
- Around 32.3% of women wanted to give birth, while 50% wanted to abort due to rape-related pregnancy.[5]
Source – American Journal of Preventive Medicine, National Library of Medicine

Late-Term Abortion Statistics
Late-term abortion is not a medical term, but rather a political one. Abortions after the 20th week (latter part of the second trimester) of pregnancy are considered late-term.
- Around 92% of abortions occur in the 13-week gestation period (first trimester), while only 7% occur from the 14 to 20-week gestation period[6].
- Abortion after 21 weeks is rare. Around 1% of abortions happen after 21 weeks of gestation in the US.
- In 2019, 36,000 abortions in the second trimester were recorded in the US.
Source – CDC
Reasons For Late-Term Abortion
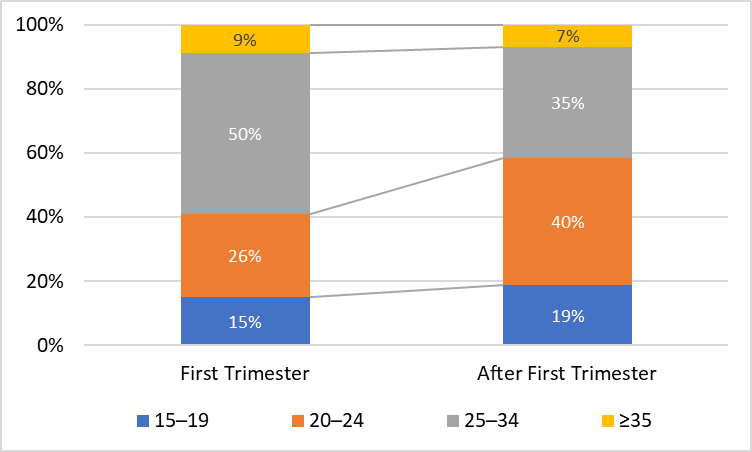
- Late-term abortion is more common in younger women. While women between 15 and 24 contribute to 41% of abortions in the first trimester, this percentage goes up to 58% for abortions after the first trimester.
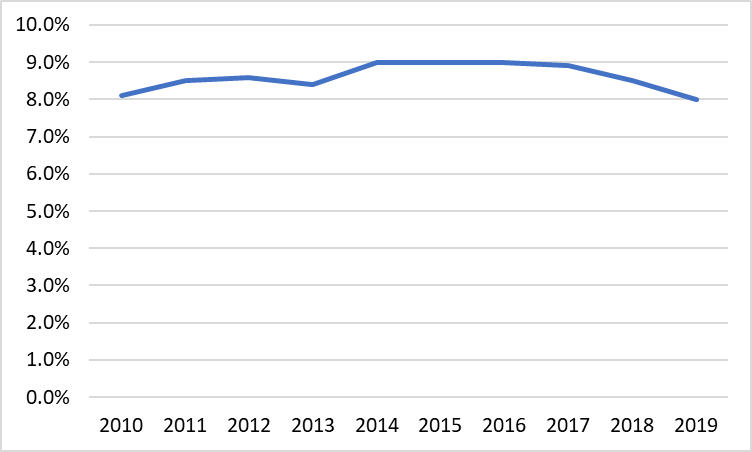
- The percentage of women seeking abortion in the second trimester has remained stable in the US, hovering between eight and nine percent throughout the last decade.
- According to the Federal Reserve, 40% of Americans can not come up with a $400 emergency fund. do not have enough savings to pay for abortion expenses. Abortion in the first trimester can cost around $500 and in the second trimester can cost $1200 or more. Saving up to pay for the abortion is likely another reason for delayed and late-term abortions.
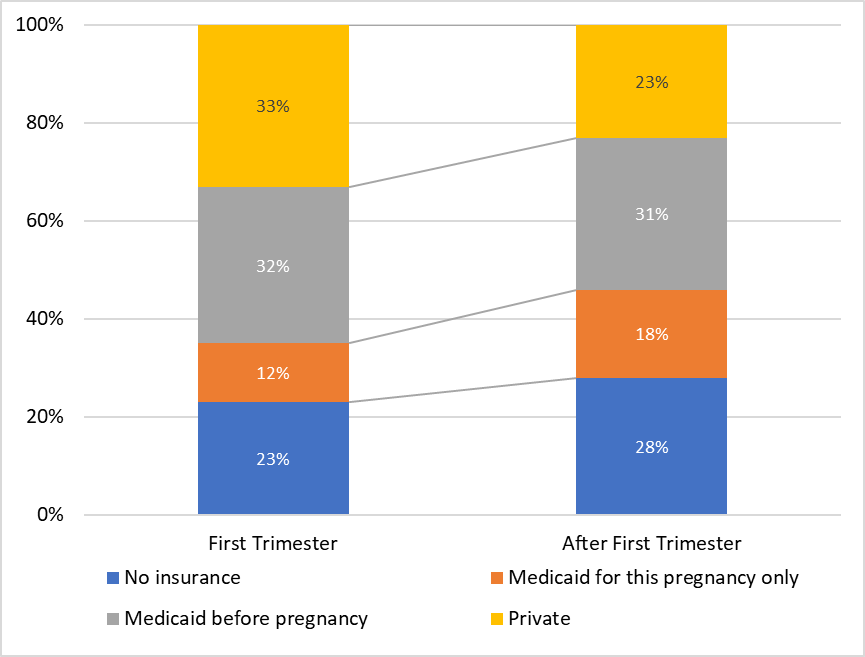
- Women having an abortion after the first trimester are more likely to not have any insurance (28%) as compared to women having an abortion in the first trimester (23%).
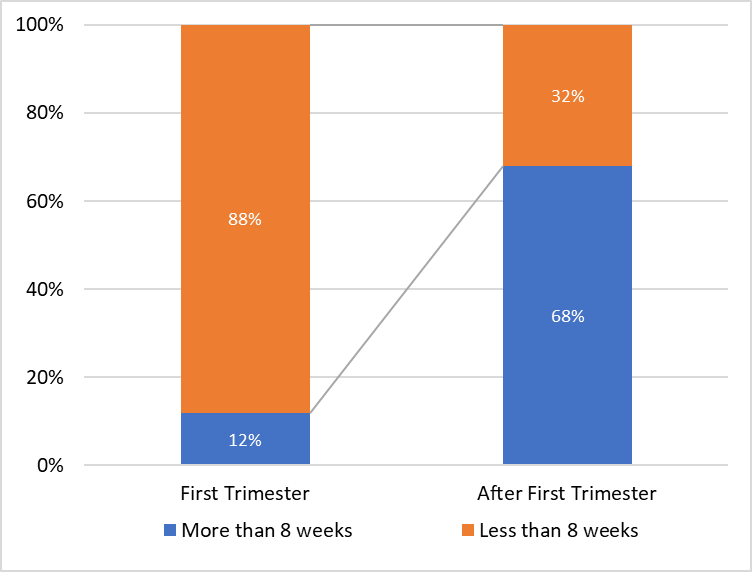
- One big reason for late-term abortion is the late discovery of pregnancy. Women who come to know of their pregnancy after eight weeks of gestation form a significantly higher proportion of the women getting an abortion after 13 weeks or the first trimester. It does take time to make a decision as big as this.
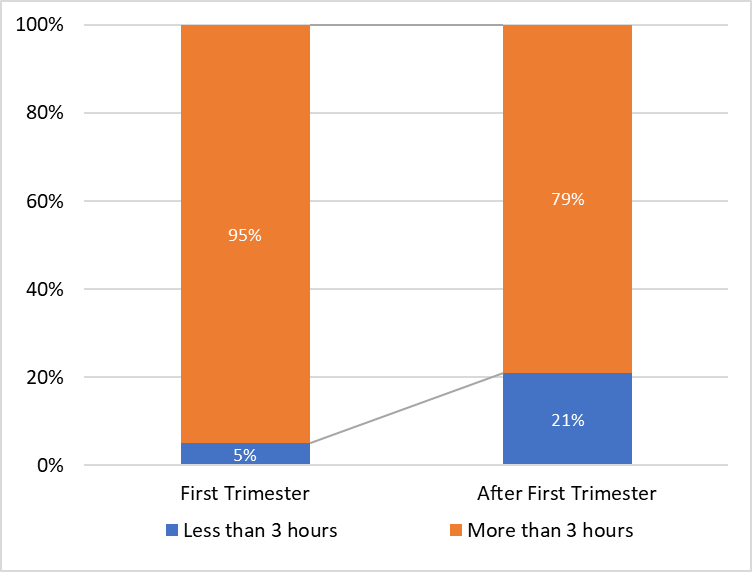
- Another reason for late-term abortions is access to the right medical facilities. Women who had an abortion after their first trimester are much more likely to have traveled more than three hours for the abortion, as compared to women getting an abortion in the first trimester (21% versus 5 %). Although this can also be a result of women seeking more privacy when getting an abortion.
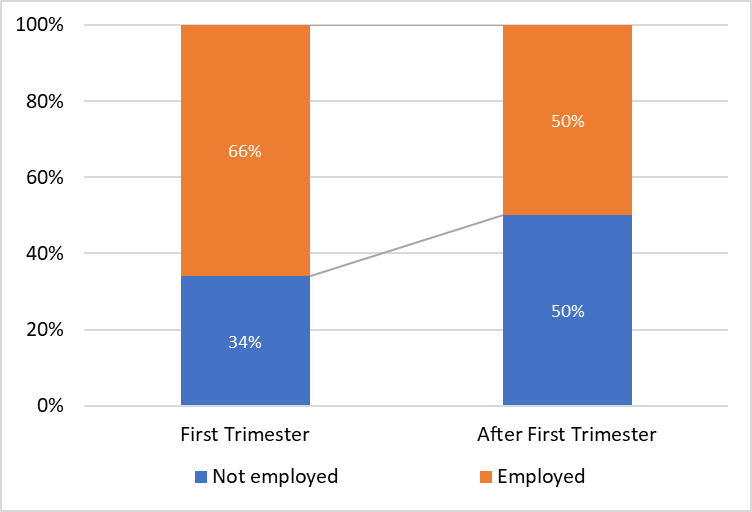
- Women getting an abortion after the first trimester are more likely to be unemployed as compared to women getting an abortion in the first trimester (50% unemployed after the first trimester vs 34% unemployed in the first trimester).
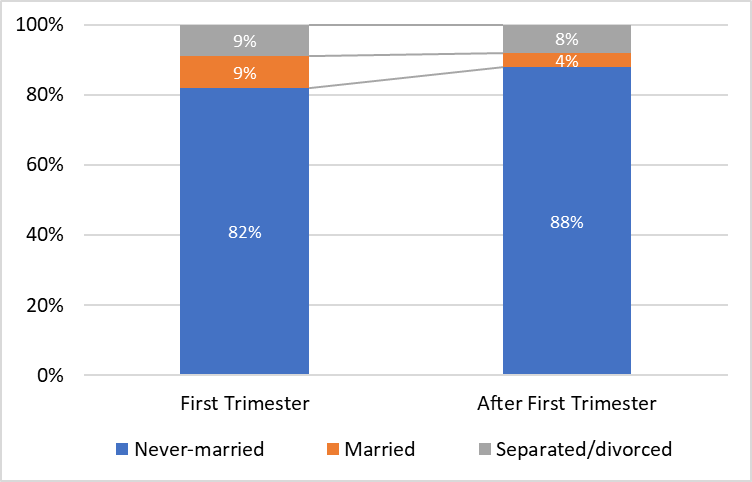
- Women getting an abortion after the first trimester are more likely to never have married as compared to women who get an abortion in the first trimester.
Source – National Library of Medicine
Abortion to Save Mother’s Life Statistics
Sometimes an abortion is necessary to save the life of the mother. One of the most common causes of maternal death due to pregnancy is ectopic pregnancy.
An ectopic pregnancy is one where the fetus attaches itself and grows outside the uterus. Such a pregnancy is unviable and needs to be terminated either medically or surgically.
- 2 percent of pregnancies in the US are ectopic.
- The leading causes of ectopic pregnancy include age (over 35 years of age), smoking, and having more than one sexual partner.
- If you have had an ectopic pregnancy before, you have a 15 percent chance (up from two percent) of having a second ectopic pregnancy.
- Having said that, one in three women (33%) who have had an ectopic pregnancy go on to have a healthy subsequent pregnancy.
Source – March of Dimes

Abortion Vs. Miscarriage Statistics
Medically speaking, miscarriage is nothing but a spontaneous and unintended abortion. Here are some miscarriage statistics for you to consider.
- Around 10% to 20% of pregnancies result in miscarriage during the first 13-week gestation period.
- 31% to 50% of women do not even know they are pregnant and miscarry.
- Miscarriage is not so common after the first trimester. Just 1% of pregnancies result in miscarriage in 13 to 20 weeks.
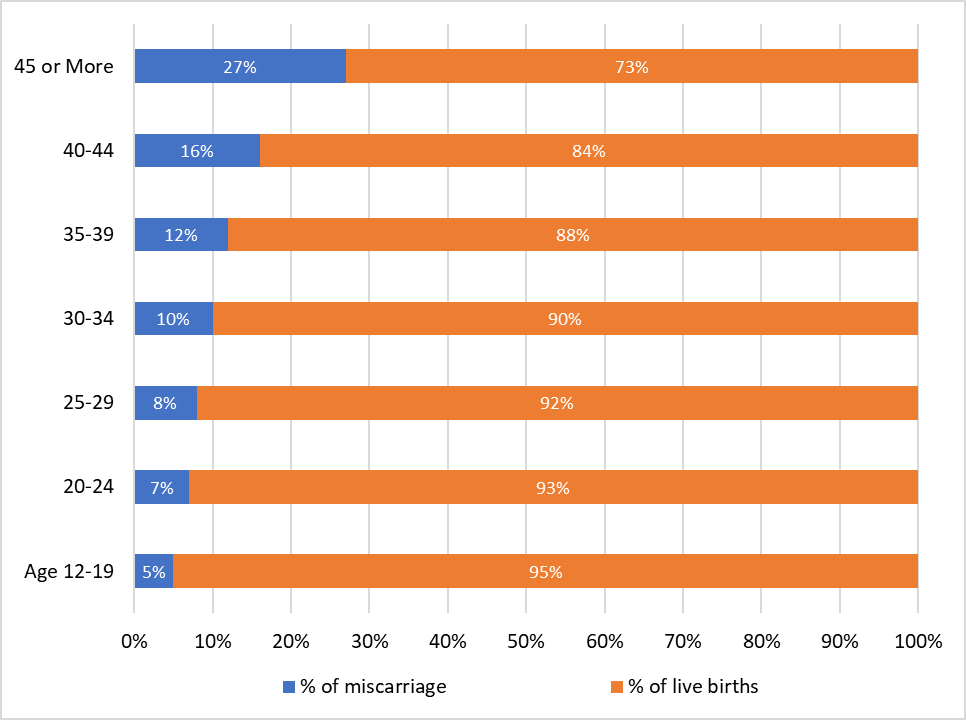
- The probability of a miscarriage increases significantly with age. One in six pregnancies between the ages 40 and 44 and more than one in four pregnancies over the age of 45 result in a miscarriage.
Source – National Library of Medicine
Sex-Selective Abortion Rate
In some countries and cultures, there is a strong preference for the male child.
- It is a known fact that the human race has preferred sons over daughters for a long time. In fact, this preference for sons over daughters has led to some rather concerning health and social indicators like reduced height, weight and lack of education and career opportunities for girls and women, especially in the developing part of the world.
- It is surprising that there is a clear preference for the male child even in the US, right from the times of World War II.
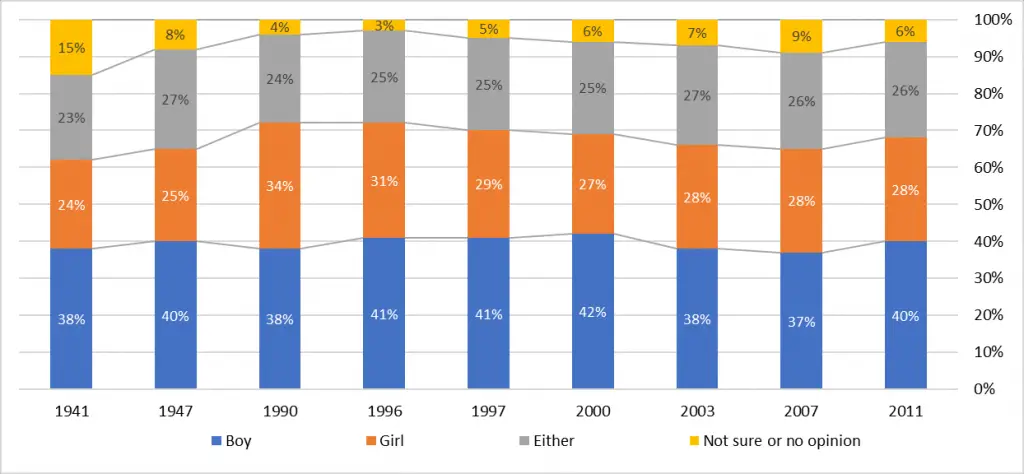
Source – Science Direct, Gallup
Abortion vs. Live Birth Statistics
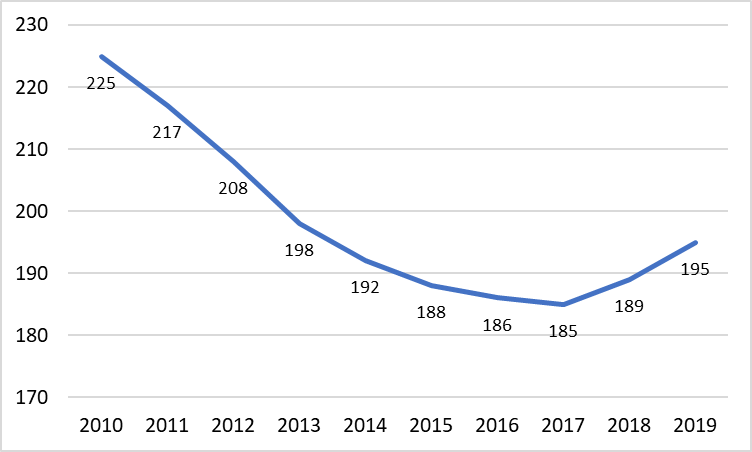
The abortion ratio is defined as the number of abortions per 1000 live births. The abortion ratio has gradually decreased in recent years.
- The number of abortions per 1000 live births has seen a declining trend. This ratio used to be 225 abortions per 1000 live births in 2010 and it has come down to 195 in 2019.
- The states reporting the highest ratio of abortions to 1000 live births were New York (355), Illinois (332), Florida (327), Georgia (292) and Connecticut (269).
- The states reporting the lowest ratio of abortions to 1000 live births were Wyoming (5), Missouri (20), South Dakota (36), Utah (62) and West Virginia (65).
- The abortion ratio (abortions per 1000 live births) is almost nine times higher among unmarried women (394) as compared to married women (46).
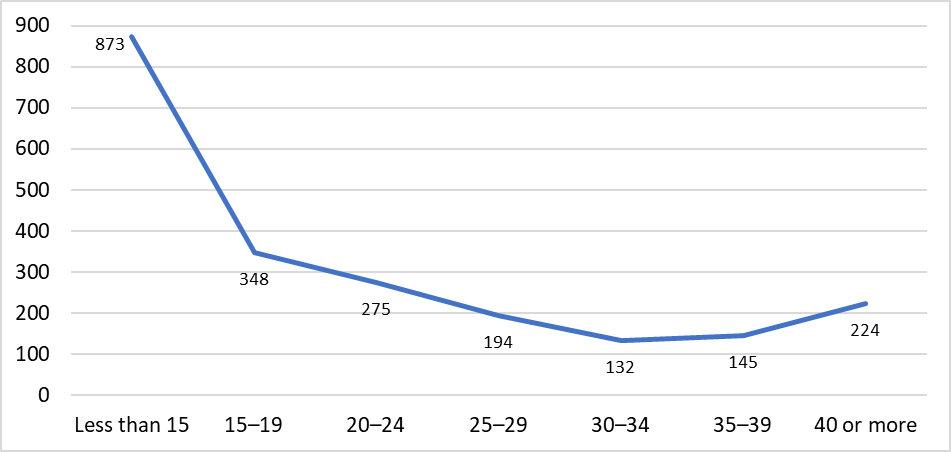
- The abortion ratio decreases rapidly with age till about the age of 30 to 34 years. After that, it increases slightly. This can be explained by the fact that the incidence of unintended pregnancies decreases with age. And after the age of 35, the incidence of unviable pregnancies increases.
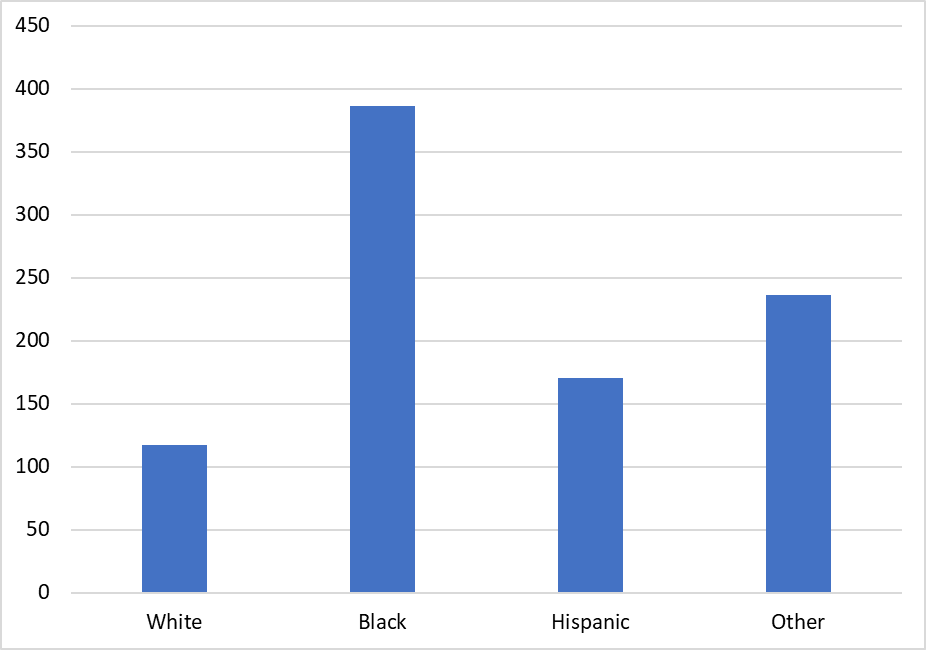
- The abortion ratio among blacks remains the highest among all ethnicities. The abortion ratio (number of abortions per 1000 live births) among blacks is more than three times as compared to that among whites.
Source – CDC
Abortion Complications Statistics
Abortion complications among women can originate from controllable factors like sanitary and hygienic conditions for an abortion to uncontrollable factors like the gestational age of the fetus or the expectant mother’s past medical history.
- Every year, 70,000 women die globally because of unsafe abortions.
- In the US, 1.3% of the abortions carried out in the first trimester result in a medical complication.
- This rate rises to 1.5% for abortions carried out in the second trimester or later.
- The mortality rate due to induced abortion was 0.6 deaths per 100,000 abortions.
Source – WHO, National Library of Medicine

Coerced Abortion Statistics
Coerced or forced abortions can lead to violence and even death among pregnant women.
- Almost two out of three women (64%) felt some form of pressure to abort their pregnancy.
- Four out of five women (79%) seeking an abortion were not clearly told about available resources.
- 65% of women reported experiencing trauma after an abortion.
Source – Heartbeat International
Self-Induced Abortion Statistics
Many women who can not afford an abortion or do not have access to one end up trying one of many (often very dangerous) ways to end the unwanted pregnancy. Often these women limited financial means and hence very limited options.
- 17 million unsafe abortions happen annually across the world.
- The most common methods of unsafe abortions are the use of misoprostol without medical advice.
- 97% of unsafe abortions, including self-induced abortions occur in developing countries.
- In the US, three out of four women (75%) who wanted to abort were low-income (annual income below 31,460 dollars for two people)[13].
- 7% of women in the US accepted using some form of self-induced abortion in their lifetime.
- Black and Hispanic women are three times more likely to attempt a self-induced abortion as compared to white women.
- Self-induced abortion also has a direct correlation with the financial means of the woman concerned. Those living below the federal poverty line are three times more likely to attempt a self-induced abortion as compared to women with an annual income at least two times the federal poverty line (annual income of $36,620). Note – for 2022, the federal poverty line was $18,310 for a family of two, annually.
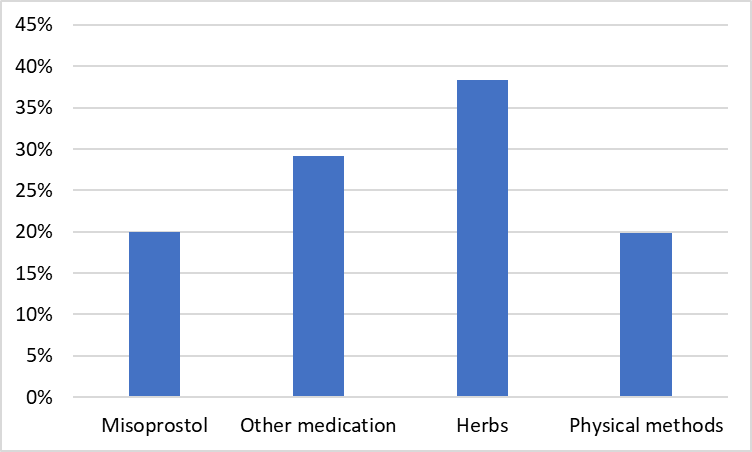
- The most commonly used medication for self-induced abortion is Misoprostol, with one in five women who attempted any form of self-induced abortion reporting using it. Shockingly, an equal number of women used some form of physical method. Many used more than one method.
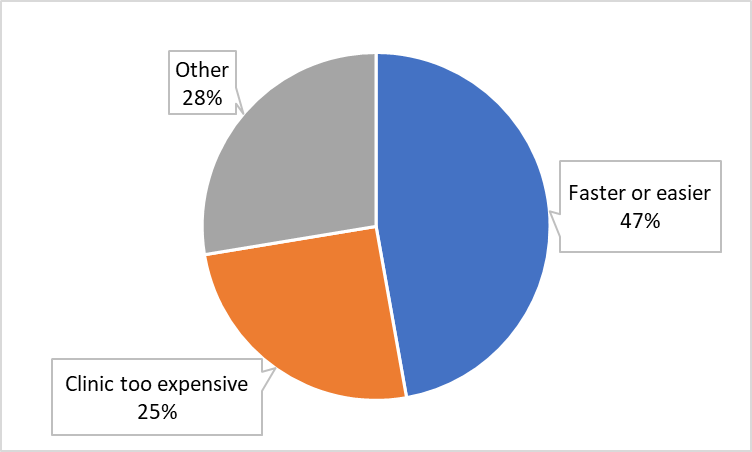
- Almost half the women use a self-induced abortion because it seems faster and easier. One in four use it because of financial reasons.
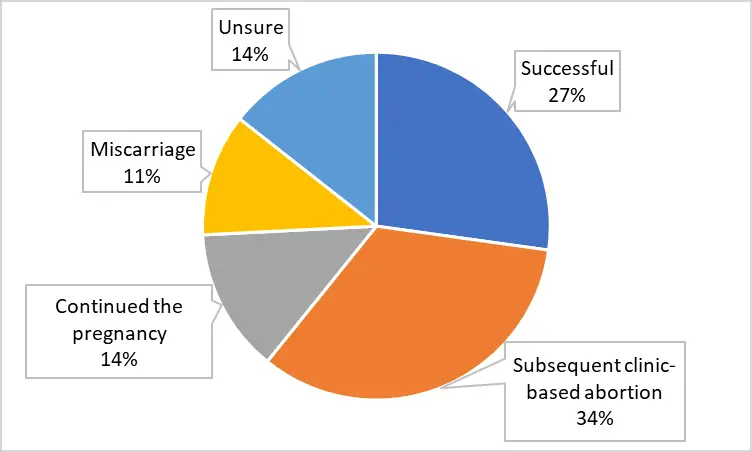
- After the self-induced abortion, more than one in three women had to seek a further clinic-based procedure. 27% reported that they were successful. 11% had a miscarriage.
- 11% of attempted self-induced absorptions resulted in complications.
Source – Guttmacher Institute JAMA Network
Abortion Statistics – Final Words
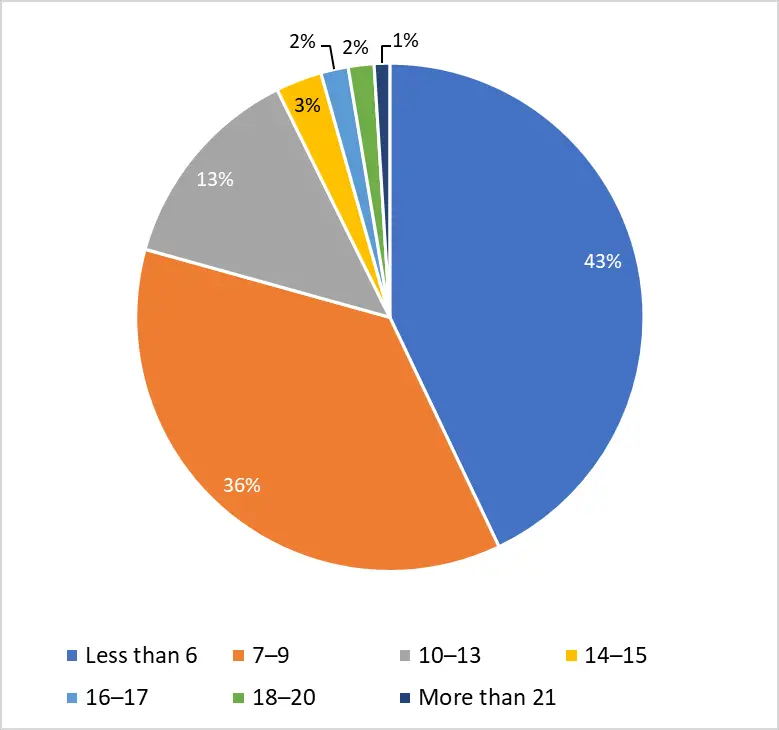
The rate of abortion has significantly changed over the last decade. Every one out of six women who are already mothers chooses to abort, and around half of the women abort in the first six weeks of pregnancy. The reason for abortion is that they are poor, unmarried, or need to study more.
The woman’s right to abort vs the right of the fetus to live has been a hotly debated topic in America. The stats clearly show that giving women the right to choose not only reduces mortality, it actually brings down the incidence of abortion itself.
We thank you for reading this article, we hope that these statistics would help you come to the right conclusions regarding abortion, the right to abortion, and the reasons behind abortion in the US.
References
[1] https://www.guttmacher.org/sites/default/files/pdfs/pubs/psrh/full/3711005.pdf
[2] https://www.scientificamerican.com/article/lessons-from-before-abortion-was-legal/
[3] https://www.guttmacher.org/perspectives50/abortion-and-after-legalization.
[4] https://www.cdc.gov/violenceprevention/sexualviolence/understanding-RRP-inUS.html
[5] https://pubmed.ncbi.nlm.nih.gov/8765248/
[6] https://www.kff.org/womens-health-policy/fact-sheet/abortions-later-in-pregnancy/
[9] https://en.wikipedia.org/wiki/Sex-selective_abortion#United_States
[10] https://www.statista.com/statistics/185286/legal-abortions-per-100-live-births-in-the-us-since-2000/
[12] https://www.heartbeatinternational.org/forced-abortions-in-america
[13] https://www.guttmacher.org/fact-sheet/induced-abortion-united-states