Caregivers are the backbone of our country. One in Five Americans is caring for others. These caregiver statistics will help you understand who our caregivers are, and what they do for us
According to a survey conducted by The National Alliance for Caregiving (NAC) and AARP in the year 2020, almost 53 million Americans are providing unpaid care to a family member or a friend [1]. The number of caregivers has increased by about 9.5 million in five years, from 2015 to 2020.[2]
However, only a few such people identify themselves as caregivers. They don’t consider helping their parents or friends, like accompanying them to a doctor’s appointment or helping them cook, as something that defines them as a caregiver. It is something that just needs to be done.
A caregiver is a person who helps someone with their daily and medical needs, if any, in case of any limitations, either short or long term, due to any injury, illness, or disability.
An informal caregiver or family caregiver means that the caregiver is assisting someone known to them or a family member, a spouse, friend, neighbor, or some other family member. Informal or family caregivers are primarily unpaid for their services to someone in need.
Then comes the formal caregivers. They are trained professionals who care for people either at their own home or in a professional care setting. Formal caregivers get paid for the services they offer.
Let us have a look at some of the statistics related to caregivers. The below-mentioned statistics refer to caregivers of adults.
Contents
Some Of The Key Facts About Caregiving In America
- According to the AARP Research Report, more than one in every five Americans are caregivers, about 21.3% of the total American population.[2]
- According to a survey from 2020, an approximation, about 53 million American caregivers act as informal or family caregivers who don’t get paid for a child or an adult in the past year. The numbers increased significantly in the prevalence of caregiving in 2020 from 2015.[2]
- For the age group 18 to 49 years, the number of family caregivers who provided unpaid care for the last year is about 6.1 million, which is 2.5% of the total prevalence of caregiving in 2020.[2]
- About 14.1 million Americans provided unpaid care for a child from 0 to 17 years in the past 12 months which is about 5.7% of the prevalence of caregiving in 2020.[2]
- For the age group of 50 and above, about 16.8% of the prevalence of caregiving in 2020 equals approximately 14.8 million Americans who provided unpaid care in the past 12 months.[2]
- The number of caregivers providing unpaid care to an adult has increased by more than 8 million, from 16.6% in 2015 to 19.2% in 2020.[2]
- Compared to the survey from 2015, the number of caregivers providing care to multiple people has increased significantly. About 24% of caregivers are caring for two or more people at once, which is 6% more than the number of caregivers caring for two or more people in 2015.[2]
- Caregivers today are diverse and come from every age group, socioeconomic group, religion, gender, and race.[3]
- 88% of caregivers reside in urban or suburban areas, while 12% reside in rural areas. 69% of care recipients decide in suburban or urban areas, while 31% live in rural areas.[3]
- About 1 in 10 caregivers have served in the U.S. armed forces. 14% of the caregivers say that their recipient is a veteran. White and African American caregivers are more often veterans.[2]
Economic Value Of Caregivers
- The total value of informal or family caregiver services has grown significantly over the past two decades, with an estimated economic impact of $470 billion in 2017. With about 327 million people in the United States, the $470 billion means about $1450 per person.[3]
- The estimated value of unpaid care was less than $200 billion in 1996, which increased to about $300 billion in 2004, $354 billion in 2006, $375 billion in 2007, $450 billion in 2009, and $470 billion in 2013.[3]
- The value of family caregivers is $470 billion, which is more than the added value to the economy of America by arts/entertainment and education sectors which were about $460 billion in 2017.[3]
- The $470 billion value of unpaid caregiving by family caregivers is far higher than the total Medicaid spending on long-term services and supports (LTSS) which stands at $154 billion in 2016.[3]
- In 2020, the economic value of the unpaid care provided by more than 11 million family caregivers to people with Alzheimer’s disease or dementia was $257 billion, with the total estimated hours of care being 15.3 billion.[4]
Caregiving Statistics Based On Gender
- According to AARP’s report, three in every five caregivers are women, which equals about 61% of the total caregivers, with the average age being 49.4%. The number of female caregivers has decreased from the 2015 report, with the percentage of female caregivers being 65% in the year 2015.[2]
- Two in every five caregivers are male, equivalent to 39% of the total caregivers.[2]
- More women caregivers provide care to more than one adult at once compared to men caregivers, with the%age of female caregivers being 27% while the%age of male caregivers is 20%.[2]
- Family caregivers who are male are more likely to provide unpaid care for a relative than female caregivers. About 92% of men give care to a relative, while 88% of women care for a relative.[2]
- More women caregivers, about 55%, report having a lack of choice in providing care in 2020 compared to 50% in 2015.[2]
- About 67% of women caregivers are the primary caregiver for the recipient, which is significantly more than 59% of the main caregiver being the primary caregiver.[2]
- According to a report by the Institute of aging 2016, more than 75% of all caregivers are women, and they may spend up to 50% more time caring for their recipients than a male caregiver.[5]
- Of all care recipients, 61% are women, and 39% are men, with every two in three caregiver recipients being women and every four out of two care recipients being men.[2]
- Advocating for the care recipient is more common in 2020 than in 2015, with over 57% of women caregivers doing it in 2020 compared to 50% of women caregivers in 2015.[2]
- Women caregivers report getting paid help more than men caregivers, with 34% women caregivers over 26% men caregivers.[2]
- About 40% of women caregivers rate their health excellent.[2]
- According to the report from National Alliance for Caregiving and AARP, Caregiving in the U.S. 2009, women caregivers are most likely to provide personal care services in comparison to men caregivers. 28% of women caregivers helped a loved one get dressed compared to 24% men caregivers. About 30% of women caregivers help the care recipient with bathing compared to 16% of men caregivers doing so. About 40% of the men caregivers take help from paid assistance for the personal care of a loved one. Of the 43.4% of caregivers who care for an old family member, 14.5 million are men.[6]
- Of the caregivers providing care to patients with Alzheimer’s or other dementia, about two-thirds of them are women and almost one-third are daughters of the patients.[4]
Caregiving Tasks And Gender
- According to the survey report of the National Alliance for Caregiving and AARP, Caregiving in the U.S. in 2009, about 39% of the female caregivers take care of challenging caregiving tasks like helping with personal care, which includes bathing, dressing, and toileting. On the other hand, only 24% of male caregivers help with personal care.[6]
- According to a study, when it comes to offering spousal care to those aged 75+, both genders provide equal amounts of care for their partner.[7]
- According to survey report of the National Alliance for Caregiving and AARP, Caregiving in the U.S. 2015, higher hour caregivers who offer care services for 21 hours or more per week are 4 times more likely to be caring for their partner or spouse.[8]
- Men caregivers have significantly improved when it comes to sharing the caregiving task compared to the past, but women caregivers still do the majority of caregiving tasks. Some studies show an almost equal distribution of caregiving tasks between men and women, but women spend more hours every week providing care compared to men. Women caregivers offer 21.9 hours per week while men caregivers offer 17.4 hours per week.[6]
Caregiving And The LGBT Community
- 8% of the caregivers self-identify themselves as lesbian, gay, bisexual, and/or transgender.[2]
- According to a report, male caregivers provide more hours of care than female caregivers. LGBT male caregivers provide 41 hours of care compared to 29 hours of care provided by general mail caregivers. About 14% of gay men report working as full-time caregivers with over 150 hours a week of providing care. About 3% of lesbians and 2% of bisexual men work as full-time caregivers.[9]
- According to a report in 2014, at least 3 million people belonging to the LGBT community are of age 55 +. According to the same report, this number will double in the coming two decades.[11]
- A caregiver from the LGBT community is more likely the primary caregiver, about 78% compared to the 63% of general caregivers.[2]
- About 33% of caregivers from the LGBT community e feel alone, which is more when compared to the 20% of the caregivers from the non-LGBT community.[2]
- About 27% of the LGBT community caregivers report high financial strain, which is more than 18% of non-LGBT community caregivers. However, the LGBT community caregivers are younger, with an average of 8 years compared to non-LGBT caregivers.[2]
- 17% of LGBT caregivers report discrimination at work due to caregiving compared to 6% of caregivers of the non-LGBT community.[2]
- 36% of LGBT community caregivers would like help or information about managing stress compared to 25% of non-LGBT caregivers.[2]
Statistics About Caregiving Tasks
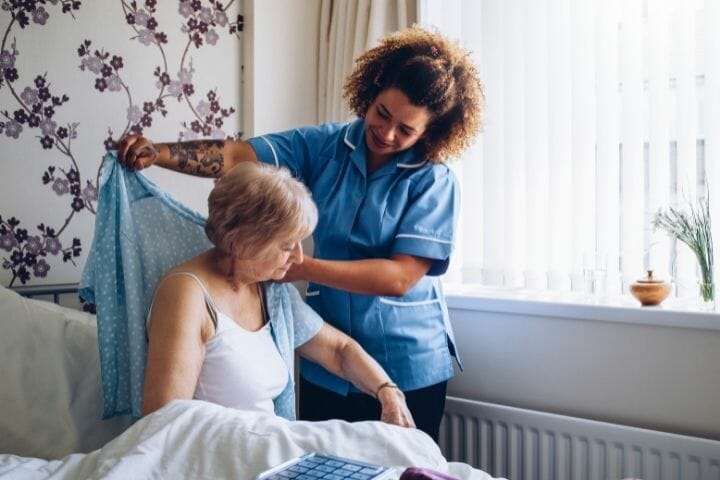
- About 99% of the caregivers help with instrumental activities of daily living or IADLs as of 2015. About 60% or six in ten caregivers help with activities of daily living or ADL. About 58% of caregivers help with medical or nursing-related tasks.[2]
- Almost 68% of the caregivers whose recipient lives with them in their home provide help for at least one ADL for their recipient. On average, caregivers help with 1.7 of the 6 ADLs.[2]
- Out of the 7 listed instrumental activities of daily living, caregivers often provide help to their recipients with 4.4 IADLs which is more than the 4.2 in 2015.[2]
- Besides ADLs and IADLs, caregivers often provide 3 key activities, monitoring the recipient’s condition, communicating with their health care professionals, and advocating with services providers and agencies for the recipient. In comparison to the 66% in 2015, about 77% of the caregivers monitored the severity of the recipient’s condition in 2020 to offer better suitable care for them. About 65% of caregivers communicate with health care professionals about the care of their recipient. More caregivers, about 56%, advocate for their recipients with the providers, agencies, and services than in 2015, which was about 50%.[2]
- About 74% of African American caregivers perform the three key activities.[2]
- More primary caregivers perform the three tasks as compared to non-primary caregivers.[2]
- 59% versus 50% advocating
- 73% versus 67% monitoring
- 69% versus 58% communicating
- 46% of caregivers who offer help for chronic care perform nursing and medical tasks. About 96% provide help with ADLs and IADLs.[11]
How Old Are Our Caregivers?
- The average age of caregivers for adults is 49.4 years. 46% of the total caregivers are in the age group 18 to 49 years. 54 % of the total caregiver are age 50 and above.[11]
- The number of hours spent on caregiving significantly increases with the increase in age of the caregiver. On average, for higher hours, caregivers are 51.8 years of age. On the other hand, lower-hour caregivers are 48 years of age on average.[12]
- Older caregivers care for their spouse or partner. About 40% of caregivers above age 75+ care for their spouse or partner. Caregivers aged 18 to 74 are more likely to care for a parent or parents-in-law.[2]
- Often the older caregivers care for older recipients. The average age of caregiver for a recipient having age 65 and above is 63 years.[2]

Time Spent On Caregiving
- 40% of the caregivers are in a high-intensity situation, 16% are in a medium intensity situation, and 43% are in a low-intensity situation. The intensity is an index based on the number of hours of care given and the number of tasks performed to help the recipient.[2]
- According to a report, on average, a caregiver spends about 23.7 hours per week caring for a recipient. One in every three caregivers provides care for 21 or more hours per week, and 21% of caregivers provide care as a full-time job of 41 or more hours per week.[2]
- Caregivers who care for someone who lives with them provide care for 37.4 hours per week. Caregivers with no help, either paid or unpaid, provide care for 27.4 hours per week which is more than the 21.7 hours per week for the caregivers with help.[2]
- Caregivers who had no choice but to care for the recipient provide 25.8 hours per week on average, while caregivers who had a choice provide 21.4 hours per week.[2]
- On average, caregivers providing care for less than a year provide 22.9 hours per week which is less than those who have been providing care for 1 to 4 years with 20.9 hours per week, and those who have been caring for five or more years provide 27.5 hours per week.[2]
- Caregivers provide care for 26.3 hours per week for recipients who live in a rural area more than a recipient who lives in an urban or suburban area with only 22.5 hours of care per week.[2]
- Caregivers with no job provide care for almost 28.9 hours per week. Whereas, caregivers with a job provide care for only 20.4 hours every week.[2]
- It is more likely for a caregiver to offer help with nursing or medical tasks if they provide care for more hours per week. 84% of caregivers help with medical or nursing tasks and provide 21 or more hours of care per week.[2]
- Caregivers of recipients with Alzheimer’s disease or other dementias provide care for an average of 21.9 hours per week.[2]
- The average duration of caregiving provided by a caregiver is 4.5 years. Every three out of ten caregivers have cared for the recipient for five years or more. About 27% of caregivers have provided care for 1 to 4 years. 43% of caregivers have provided care for less than a year.[2]
- Caregivers providing care for Alzheimer’s and dementia are more likely to provide care for longer. On average, they provide 1 to 4 years more than caregivers providing care for an illness other than Alzheimer’s.[4]
Caregiving By Race And Ethnicity
- There are 61% white caregivers, 14% African American caregivers, 17% Hispanic caregivers, 5% Asian-American caregivers, and the remaining 3% caregivers of other races in America.[2]
- The average age of white caregivers is 51.7 years, African American caregivers’ age is 47.7 years, and Hispanic caregivers’ age is 43.3 years.[2]
- The care recipients of white caregivers have an average age of 70.5 years, with the recipient age for African-American caregivers being 60 4.9 years, recipient of Hispanic caregivers 66.9 years, and recipient Asian American caregivers 69.1 years.[2]
- Care recipients of Asian American (51%), Hispanic (48%), and African American (45%) are more likely to live with a caregiver in their home as compared to white caregivers (36%).[2]
- White caregivers provide 21.2 hours of care per week, African Americans provide 31.2 hours per week, Asian Americans provide 24.1 hours per week, and Hispanic caregivers provide 26 hours of care per week.[2]
- 52% of white caregivers provide medical and nursing help to their recipients, while African American and Hispanic caregivers provide 67% of help in medical and nursing tasks.[2]
- 54% African-American, 49% Hispanic, 35% white, and 32% Asian American are in high-intensity care situations with their recipient.[2]
- About 52% of Hispanic caregivers are sole unpaid caregivers.[2]
- About 21% of Hispanics, 20% of African Americans, 17% of Asian Americans, and 9% of white caregivers are children.[2]
- 14% of Hispanic caregivers, 24% of white caregivers and 23% of Asian American caregivers report having paid and unpaid help.[2]
- 35% of Hispanic caregivers, 41% of Asian American caregivers, 45% of white caregivers, and 34% of African-American caregivers rate their health excellent.[2]
- About 17% of Hispanic caregivers, 27% of Asian American caregivers, and 24% of white caregivers report that their health has gotten worse with caregiving.[2]
- Asian-American caregivers feel the highest level of emotional stress at about 44%, with 29% of African Americans and 32% of Hispanic caregivers reporting high levels of emotional stress.[2]
- 48% Asian American caregivers, 46% white caregivers, 59% African-American caregivers, and 61% of his panic caregivers report that caregiving provided them with a sense of purpose.[2]
- 55% of the white, Hispanic, African American caregivers work a job that pays hourly, while Asian American caregivers work a job on a salary basis.[2]
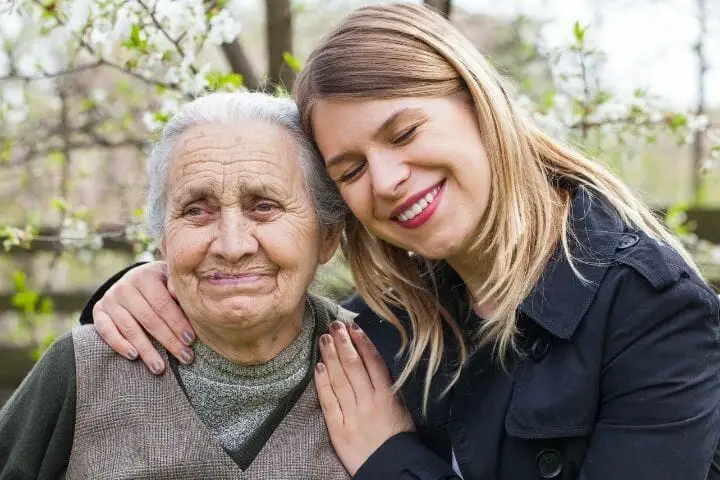
How Caregivers And Care Recipients Are Related
- About 89% of the total caregivers are related to their recipients somehow. About 50% of caregivers care for their parents or parents-in-law. 12% of caregivers care for their spouse or partner, 8% of caregivers care for their grandparents or grandparent in law 7% of caregivers care for siblings or siblings in law.[2]
- 6% of caregivers care for other relatives, while 10% of caregivers care for someone who is not related to them in any way.[2]
- The percentage of care recipients living with the caregiver is 90% for a spouse or partner, 34% for parents or parents in law 36% for other relatives, and 17% for non-relatives.[2]
- 79% of caregivers caring for their spouse or partner communicate with healthcare professionals, 78% monitor the severity of their condition, and 63% advocate for them with providers, services, and agencies.[2]
- 67% of caregivers caring for their parents or parents-in-law communicate with healthcare professionals on behalf of the recipient, 73% monitor the severity of their condition, and 60% advocate for them with providers, services, and agencies.[2]
- 61% of caregivers caring for their other relatives communicate with healthcare professionals on behalf of the recipient, 69% monitor the severity of their condition, and 52% advocate for them with providers, services, and agencies.[2]
- 48% of caregivers caring for recipients not related to them communicate with healthcare professionals on behalf of the recipient, 54% monitor the severity of their condition, and 40% advocate for them with provided services and agencies.[2]
- 69% of caregivers care for their parents or parents-in-law, 51% of caregivers care for their spouse or partner, 57% of caregivers care for their other relatives, and 46% of caregivers caring for a non-relative are employed.[2]
Wrap up
Caregivers are essential for anyone who has trouble taking care of themselves because of an injury or disability. Often people neglect the importance of a caregiver and how much value to add to our community.
While researching the facts, I became aware of information that I would never have thought about. I hope reading these statistics helps you realize how much of a critical part they play for a care recipient. Please share these statistics with others in your circle and also on social media and in your groups. Let us make the work done by these brave unsung heroes known and popular!
References
- [1] Caregiving in the US 2020
- [2] Caregiving in the US 2020 – AARP Research Report
- [3] Valuing the Invaluable 2019 Update: Charting a Path Forward
- [4] New Alzheimer’s Association Report Examines Racial and Ethnic Attitudes on Alzheimer’s and Dementia Care
- [5] Institute on Aging | Information on Senior Citizens Living in America
- [6] Caregiving in the U.S. 2009
- [7] Comparison of informal caregiving by black and white older adults in a community population
- [8] Caregiving in the US – AARP 2015 Report
- [9] Still Out, Still Aging: The MetLife Study of Lesbian, Gay, Bisexual, Transgender Baby Boomers
- [10] THE EXPERIENCES AND ATTITUDES OF LESBIAN, GAY, BISEXUAL AND TRANSGENDER OLDER ADULTS, AGES 45-75
- [11] Home Alone Revisited: Family Caregivers Providing Complex Care
- [12] Chronic Conditions: Making the Case for Ongoing Care
